Low Level NOX Measurements and Related Compliance Issues on Gas Turbine Combined Cycle Units |
Richard D. McRanie, RMB Consulting & Research, Inc.
Introduction
Most environmental regulatory agencies have, because of Best Available Control Technology (BACT) requirements, determined that new gas turbine combined cycle units must be equipped with selective catalytic reduction (SCR) NOX control technology. Consequently, permits for these new units contain NOX limits in the range of 2 - 5 ppm. In addition, newer control technologies and catalytic combustion technology offer the potential for combined cycle NOX emission rates as low as 1 ppm. All of these new units will be required to install continuous emissions monitoring systems (CEM) to measure compliance with the permit limits and to measure emission rates under a variety of regulatory programs. Certifying these CEMS, making reliable and accurate measurements, and passing daily and other periodic QA/QC checks has been shown to be problematic at these very low emission levels.
In addition, because these new combined cycle units are subject to the regulatory requirements of 40 CFR Part 60, Subpart GG, Subpart Da or Subpart Db and to 40 CFR Part 75, there are many conflicting regulatory requirements. Some of these conflicts setup situations where it is impossible, and even dangerous, to comply with the regulatory requirements.
The utility industry and the regulatory community must address these measurement and regulatory conflict issues very soon. This paper explores some of these issues in more detail.
The Low Level NOX Measurement Problem
Continuous, accurate and reliable measurement of NOX emission concentrations in the range of 1-5 ppm is a very difficult undertaking. A number of issues associated with this endeavor immediately come to mind and include:
When we first started worrying about this measurement problem about a year ago, there were no Protocol NOX span gases available that were suitable for analyzer ranges of 0-10 ppm. Such low analyzer ranges are required to meet a variety of regulatory requirements. For example, Part 75 strongly suggests that the majority of readings be above 20% of the span of the analyzer. There are now several of the Protocol gas vendors marketing NOX span gases with concentrations as low as 0.5 to 1.0 ppm so the Protocol gas problem may be solved. One does wonder how the future demand for these low-level gases will be met since mass production may prove to be problematic.
There is considerable concern about the precision and accuracy of the reference method (Method 7E) that is used to certify and periodically audit the CEMS. Method 7E was developed a number of years ago when the lowest NOX concentration that was likely to be encountered was 50 - 100 ppm. Is this reference method suitable for measuring concentrations in the 1 - 5 ppm range? There is also the issue of what performance specification should be used for CEMS certification and periodic relative accuracy test audits (RATA). There are specification conflicts in the various regulations and these conflicts will be discussed in more detail later in this paper.
The reference method "suitability" question leads directly to the next point because a conventional CEMS, as might be installed on a combined cycle unit, looks just like a set of reference method equipment - the only difference being that the CEMS is calibrated once a day instead of after every test run. Therefore, is present day CEMS technology suitable for continuous measurement of NOX concentrations in the range of 1 - 5 ppm? When one looks at data from low emitting units, considerable noise is evident in the readings.
On a unit equipped with SCR, the flue gas will contain some excess NH3 that is unreacted in the NOX reduction process. This NH3 can be converted to NO if a high temperature NO2 to NO converter is used on the NOX analyzer. Even if a low temperature converter is used, some small portion of the NH3 might still be converted. If the "responsible" regulatory agency requires the measurement of NH3 slip, the CEMS becomes mechanically complicated and differential measurements are required, thereby further compromising accuracy. It should be noted that NH3 has a poor probability of even making it to the NOX analyzer in a conventional "full concentration" extractive sampling system. The NH3 is very reactive and most will be removed with the H2O in the sampling system condenser.
The BACT analysis associated with permitting a new electric generating unit is a technology assessment process that does not deal with the accuracy and reliability of emission measurements. Permit limits are then set as specific numbers with no error margin. There is the implicit assumption that the emission measurements can be made with no error and this is not the case. It is fair to say that the entire BACT analysis and permit limit setting process is seriously flawed with regards to low emitting sources equipped with CEMS. The process will lead to permit limits that the source has no probability of meeting on a continuous basis. In turn, there will be enforcement action and plenty of it.
Are the very low NOX limits appropriate considering the measurement problems? Clearly, many regulatory agencies think the limits are reasonable and it is only now dawning on them that there may be compliance and enforcement problems caused by the simple fact that the emission measurements are very difficult to make.
It is essential that the measurement difficulties be effectively communicated to both users and regulatory agencies. To this end, EPRI has organized a small advisory group and initiated a project to evaluate the reference method and CEMS measurement difficulties, document user experience, define present CEM capability and identify research needs. Personnel from regulatory agencies, instrument vendors, Protocol gas vendors, testing contractors and utilities are represented on the committee. The remainder of this paper will describe the project progress to date.
Initial User Survey
Since a number of utilities are rapidly building combined cycle units and are effected by the low level NOX measurement problem, an initial users survey was supported by the Utility Air Regulatory Group (UARG). RMB prepared a survey form and developed a list of potential low level NOX sources. The criteria for the survey was that the sources were combined cycle units that had been in service for more than a year and that had permit limits of 5 ppm NOX or less. A number of sources were contacted and the survey form was sent to 20 sources that agreed to consider responding. Unfortunately, only five sources ultimately responded. Notwithstanding this limited response, there was some interesting information contained in the responses. Major observations and conclusions developed from the responses were:
In general, all of the sources expressed concern with the difficulty associated with the low-level NOX measurements. At the same time, all stated that given adequate resources of personnel, time, and money, the measurements could be made fairly reliably. (It is virtually impossible to get a negative answer to a question that might reflect on a person's job performance.) Subsequent analysis of the respondents Electronic Data Reports (EDRs) yielded a couple of interesting observations that are shown graphically in Figures 1 and 2 below.
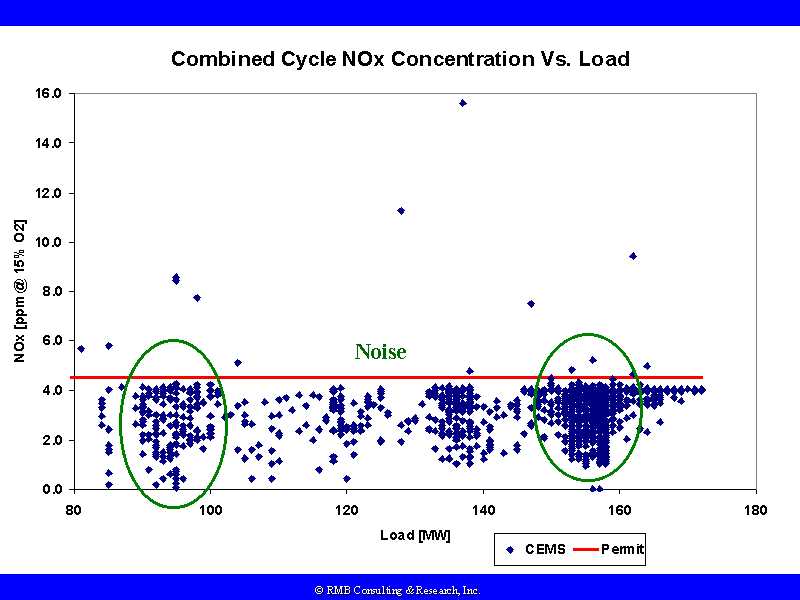
Figure 1 is a graph of one quarter of NOX data from one of the units plotted as load versus NOX concentration. A couple of observations can readily be made. One surprising observation (considering the survey responses concerning stable readings) is that the data are very noisy at any given load point. This unit has an emission limit of 4.5 ppm and the noise level, at any given load point, appears to be about 3 ppm. Another interesting observation is that the data have been given a "flattop" just below the compliance level. This indicates that source's response to approaching the limit is to increase the NH3 feed to the SCR.
Figure 1
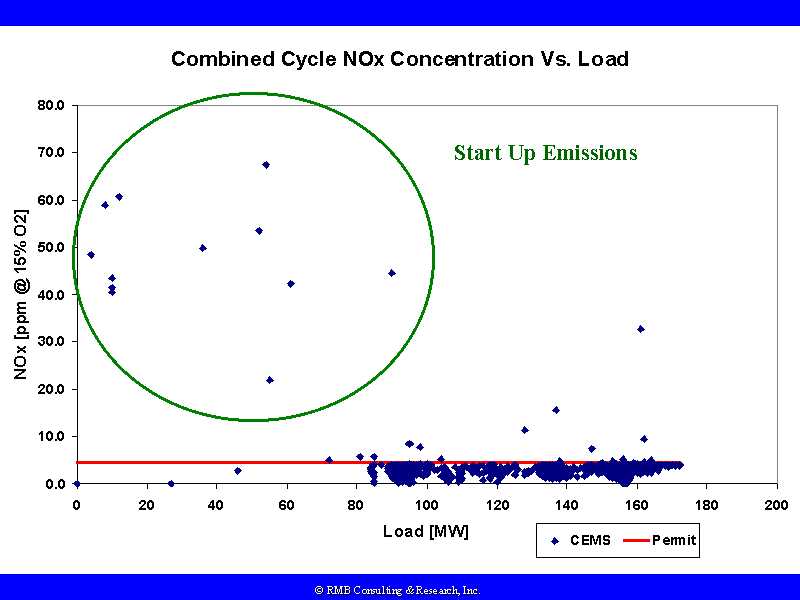
Figure 2
Figure 2 is a graph showing typical startup emissions. While all of the surveyed sources had a permit allowance for startup, there were complaints that the conditions were too restrictive. Because of the NOX control used for combined cycle units (dry low NOX burners combined with SCR), high NOX emissions are inevitable during startup. The combustion turbine burners cannot be put into lean burn mode until the turbine is up to 50-60% load and the SCR cannot be put into service until the gas temperature is up to 650 - 700º F. Figure 3 shows a typical startup over time and, in this case, the startup took about 13 hours.
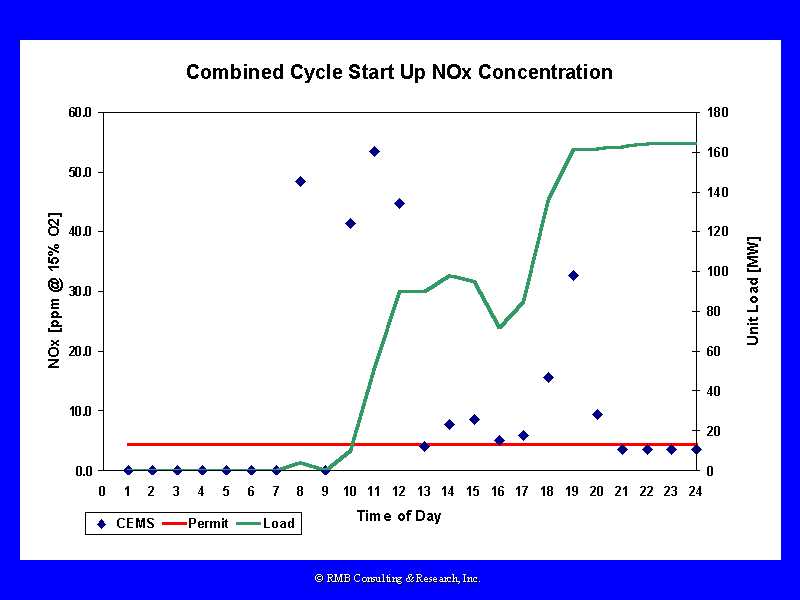
Figure 3
Defining the Low Level NOX Measurement Problem
Following initiation of the EPRI Low Level NOX Project, it was decided to determine the range of the effected population of units and to better define the extent of the problems that might be impacting these units. To accomplish this, all of the 1998-1999 EDRs (over 12,000 EDRs) were screened to select all units where the majority of NOX emission readings were less than or equal to 10 ppm. We were somewhat surprised at the fairly large number of units (115) that passed the 10 ppm criteria. We then further subdivided the total population into lower and lower "majority of NOX readings less than" categories. Table 1 below shows a breakdown of the resulting tabulation. It is interesting to note that almost half of the units have a majority of readings below 4 ppm and 28% have a majority of readings below 2 ppm.
Table 1 - Low-NOX Unit Statistics
Majority
of Readings |
Number of Units |
% of Readings > ppm |
10 |
115 |
21.5 |
8 |
100 |
27.3 |
6 |
71 |
40.2 |
4 |
55 |
35.2 |
2 |
32 |
51.8 |
We quickly scanned the data for RATA and daily calibration drift failures and were a bit surprised to find no RATA failures and only a few calibration failures. Upon reflection, we realized that this is perfectly logical because we were looking at Part 75 EDRs and the RATA and calibration drift specifications for low-NOX emitters are fairly lenient in Part 75. However, many of these combined cycle units are also subject to 40 CFR Part 60, Subpart Da and/or Db and also have to comply with Appendix F of Part 60. Those specifications are much more stringent. Table 2 below lists the applicable CEM QA/QC specifications for Part 75 and Part 60.
Table 2 - CEMS QA/QC Specifications
Specification |
Part 75 |
Part 60 |
RATA |
< 5.5 ppm |
10% of
applicable standard |
Daily Cal. Drift |
< 10.0 ppm |
5% of span
for 5 days** or 10% any day |
| Notes: * Values normalized to typical combined cycle exhaust conditions, a 3.5 ppm emission limit and a NOX analyzer range of 10 ppm. ** Span adjustment required on any day that drift exceeds 5% of span. |
||
While we cannot imagine that EPA contemplated "applicable standards" of 2 - 3 ppm when Appendix F was written, it should be kept in mind that Appendix F applies to any CEMS that is used for determining compliance with an emission limit on a continuous basis. Does this conflict between the Part 60 and Part 75 QA/QC requirements mean that Part 75 should be made stricter and Part 60 made more lenient? Since Part 75 is just counting tons of emissions and modern combined cycle units emit very few tons of NOX, these specifications are probably adequate. We have no real opinion yet on the stringency of Appendix F but are attempting to better define the capability of CEMS at these very low NOX concentrations.
Further analysis of the low-NOX emitting unit data were done to evaluate span drift, keeping in mind that the likely compliance level would be 3.5 ppm and the likely analyzer span would be 10 ppm. However, since there were a variety of analyzer ranges represented in the data, we decided to break down the data relative to the range. Tables 3 and 4 below show the span drift statistics. There are over 35,000 daily calibrations represented by these data. It should be noted that these statistics were completed only a few days ago, are preliminary, and have not been thoroughly reviewed.
Table 3 - Span Drift Statistics, ppm
Range of
Analyzer |
Drift
Difference |
Drift
Difference |
0-10 |
0.6% |
3.3% |
0-20 |
5.1% |
20.1% |
0-25 |
1.8% |
5.3% |
0-50 |
1.3% |
9.3% |
0-100 |
1.0% |
13.2% |
Table 4 - Span Drift Statistics, % of span
Range of
Analyzer |
Drift
Difference |
Drift
Difference |
0-10 |
2.7% |
8.9% |
0-20 |
9.5% |
26.9% |
0-25 |
8.4% |
22.1% |
0-50 |
3.1% |
17.0% |
0-100 |
4.1% |
16.8% |
These statistics are not very encouraging when one considers that the CEMS are measuring compliance with a very low NOX emission limit. Further analysis of these data will be done to better clarify the drift characteristics.
Another interesting analysis was done to examine the bias test failure rate. Since the bias test is a one-sided test (only negatively biased CEMS fail the test), it does not tell the entire story but the results are somewhat discouraging. Table 5 below shows the bias test results for the low-NOX CEMS, again grouped by analyzer range.
Table 5 - Bias Test Statistics
Range of Analyzer, ppm |
% Failed Bias Test | Average BAF |
0-10 |
75% |
1.11 |
0-15 |
33% |
1.05 |
0-20 |
40% |
1.12 |
0-30 |
30% |
1.12 |
0-50 |
38% |
1.06 |
If one assumes that the bias test tells us something about the combined precision of the CEMS and the reference method (at least on the day when the RATA was performed), these data do not paint a pretty picture. We do not have the statistics for the positively biased CEMS, but mathematically (assuming random error) we would expect as many positively biased CEMS as there are negatively biased. If error is truly random, one would expect 33% of the bias tests to be positively biased, 33% to be negatively biased and 33% to be unbiased. It is interesting that the assumption of random error appears to hold for every analyzer range shown in Figure 5 except for the 0 - 10 ppm range. This may imply that there is a systematic error on these CEMS but, frankly, it is just too early to draw that conclusion.
Future Efforts
The preliminary data analysis certainly supports the idea that very low NOX emissions are difficult to measure accurately and reliably. EPRI is planning to support continuing work to further evaluate existing CEM and reference method technology, and to develop concepts for improving the state-of-the-art. To that end, the following near-term activities are planned: